ARIEIRA ET AL. 2018 data sets

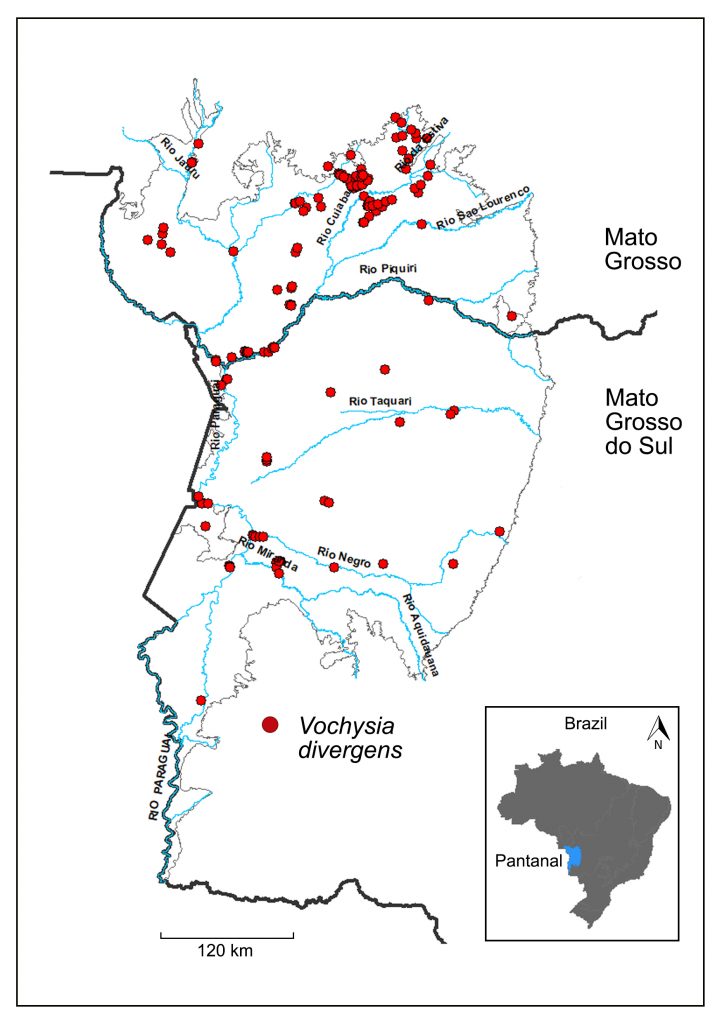
Figure1. Study site and occurrence of Vochysia divergens used to model environmentally suitable areas for the occurrence of this species.

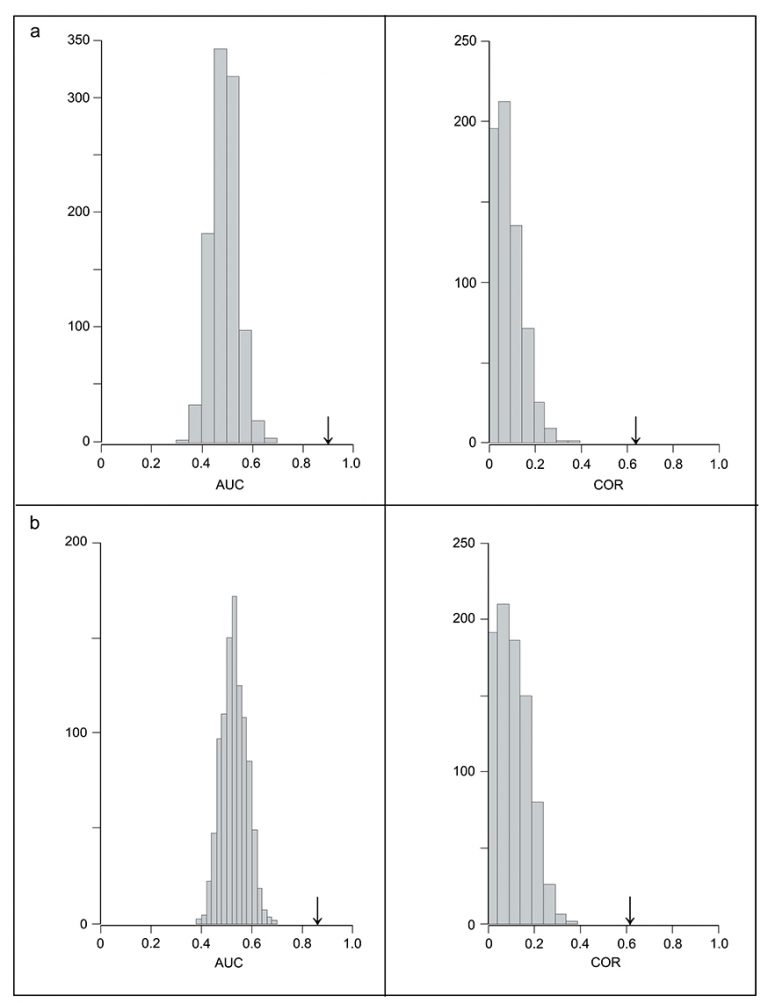
Figure 2. Histogram with the values of (a) DOMAIN, (b) BIOCLIM.  Correlation (COR) produced by the 1000 runs of the null model with DOMAIN and BIOCLIM and (AUC) Area Under the ROC-Curve. Arrows indicate the values of AUC (0.88) and COR (0.6) resulting from the species distribution models generated using observed data for species occurrence.

Figure 3. Maps of the probability of occurrence of Vochysia divergens in the Pantanal predicted by the models (a) BIOCLIM and (b) DOMAIN. Cut-off thresholds of 0.10 and 0.68, respectively, were used to define habitats with a higher chance of establishment of this species. Inserted map: predicted V. divergens occurrence (blue) considering different thresholds based on model a and b.

Figure 4. Maps of climatic and hydrological gradients: (a) mean annual temperature (Bio1), (b) mean temperature of the wettest quarter (Bio8), (c) precipitation in the rainiest month (Bio 13), (d) precipitation in the hottest quarter (Bio18), (e) precipitation in the coldest quarter (Bio19), (f) sum of 10 years of flooding (SUMflood).